openGemini v1.3.0, a suite of exciting new features comed
What exciting new features does openGemini v1.3.0 have?
The openGemini v1.3.0 version introduces a suite of exciting new features, including support for multiple replicas, which provides a stronger guarantee for data high availability. Additionally, this version also introduces support for the PromQL query language, allowing users to directly leverage the powerful query capabilities of PromQL within openGemini, handling both instant and range queries with ease. In terms of performance, v1.3.0 has optimized several key scenarios, achieving higher efficiency and lower latency in both data writing and query response. These optimizations have significantly improved openGemini's processing speed and resource utilization. On the operational side, the v1.3.0 version offers data backup and recovery tools, supporting full and incremental backups, as well as full and incremental data recovery, providing users with important tools for data security and disaster recovery. The design of the backup and recovery tools considers various deployment forms, including single-node, cluster single replica, and cluster multiple replicas. These improvements, coupled with further optimizations to the storage engine and indexing mechanisms, make openGemini v1.3.0 a more powerful, efficient, and reliable time-series database solution.
Features
Use PromQL to query data directly from openGemini
PromQL is a powerful, concise querying language for Prometheus.

Examples
This example selects all time series that have the
http_requests_totalmetric name:// PromQL http_requests_total // openGemini HTTP API curl -i -XPOST 'http://127.0.0.1:8086/api/v1/query?query=http_requests_total'This example selects only those time series with the
http_requests_totalmetric name that also have thejoblabel set toapiserverand theirhandlerlabel set to/api/comments:// PromQL http_requests_total{job="apiserver", handler="/api/comments"} // openGemini HTTP API curl -i -XPOST 'http://127.0.0.1:8086/api/v1/query?' --data-urlencode 'query=http_requests_total{job="apiserver", handler="/api/comments"}'This example select all the values we have recorded within the last 5 minutes for all time series that have the metric name
http_requests_totaland ajoblabel set toapiserver:// PromQL http_requests_total{job="apiserver}[5m] // openGemini HTTP API curl -i -XPOST 'http://127.0.0.1:8086/api/v1/query?' --data-urlencode 'query=http_requests_total{job="apiserver"}[5m]'Related Reading Use PromQL
Data Replication
In openGemini v1.2.0 and earlier versions, data has no data replication. However, starting from v1.3.0, openGemini supports data replications, meeting the data reliability requirements of most scenarios such as industry, energy, and the Internet of Things.

Related Reading Data Replication
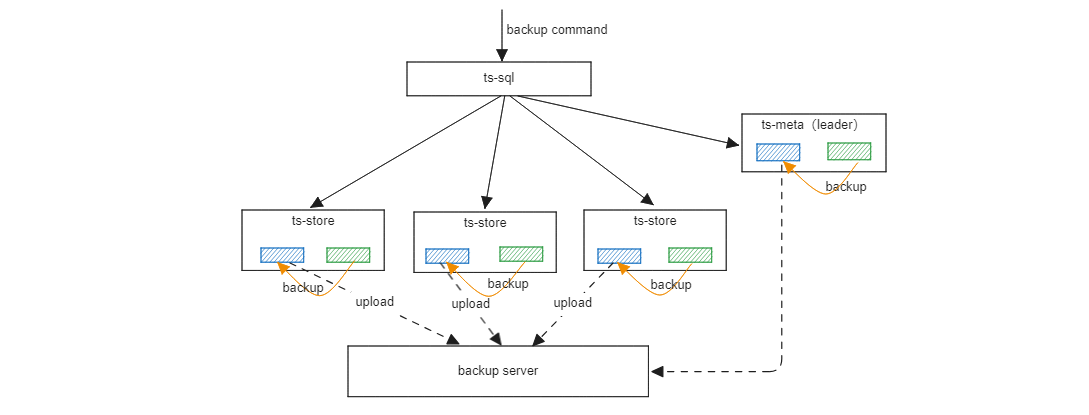
Backup & Restore
Both stand-alone and clustered support data backup, including full backup and incremental backup. In addition, we also support offline data recovery, which can be restored to the original node or to a new node. Data is backed up locally, and backup to a remote backup server is not supported.
Related Reading Backup & Restroe
Support Prometheus to pull runtime monitor metrics data from openGemini
curl -i -XPOST 'http://127.0.0.1:8086/metrics'A new command
show clusterfor get cluster status> show cluster time status hostname nodeID nodeType availability ---- ------ -------- ------ -------- ------------ 1725071376777471503 alive 127.0.0.3:8091 1 meta available 1725071376777471503 alive 127.0.0.1:8091 2 meta available 1725071376777471503 alive 127.0.0.2:8091 3 meta available 1725071376777471503 alive 127.0.0.1:8400 4 data available 1725071376777471503 alive 127.0.0.2:8400 5 data available 1725071376777471503 alive 127.0.0.3:8400 6 data available
Performance
Topn() **performance optimization **
Optimize the time range query scenarios. for example
select topn(http_requests_total, 10) from mst1 where time >=now()-2h, In practical application, the average latency of 100 concurrent queries is reduced from 256ms to 68ms, and the end-to-end performance is improved by 2 to 4 times.Data writing optimization
For data writing scenarios where the number of TAGs is huge, the TAG Value is particularly long, or the TAG array is relatively large, the CPU overhead can be reduced by 20% by optimizing WAL network transmission, Cache compression, and index update code logical, etc. In practical application, write performance increased from 370,000 rows/s to 600,000 rows/s
Configuration
[index]
  cache-compress-enable = true
  bloom-filter-enable = true
Batch query optimization
For batch query scenarios, such as dashboard applications, most query conditions are the same. By caching the inverted index query results, In practical application, 10 million time series , the batch query performance is improved by nearly 100%.
show tag valuesperformance optimizationOptimizing query strategies can improve performance by 5-10 times when querying the tag values with high cardinality and limits.
Memtable query performance optimization
The massive time series real-time data make memtable cache many data. At the same time, there have a large concurrent query, which leads to high CPU and poor query performance. By reducing data deep copies and GC optimization, the query performance can be further improved.
Multi-Field query optimization
In scenarios where there are many field filters in the query conditions, there will be problems such as high query latency and high CPU overhead. By optimizing the index scanning algorithm, the CPU consumption in the Index Scan stage of multi-field scanning scenarios is reduced from 75.36% to 0.53%.
Bug Fix
- Fixed the issue that RP cannot be specified when deleting a table #666
- Fixed the issue that occurring some failed when deleting measurements in batches #482
- Fixed the issue that the command line text was wrong when viewing the history commands in ts-cli #651
- Fix ts-store restart panic #481
- Fixed the issue of text index file loading failure #700
Reference
How to contribution: